Customized geom
mc_model_custom.RdCustomized geom
mc_obs_custom(plot, ...)

mc_model_custom(plot, ..., n_sample = NA, group_sample = "collapse")
Arguments
- plot
The plot to use. It should be a geom function like geoms in
ggplotsand should be able to havedataandmappingaugments. See examples for more details.- ...
Augments passed to
plot.- n_sample
The number of sample of draws to show. Default
NA. Ifn_sampleisNA, thenmc_model_custom()will use all draws from posterior distribution.- group_sample
How to show draws? Default
"hops". Ifgroup_sampleis"collapse", then all draws are collapsed together and are shown in one geom; if"draw"is"group", then only one draw is shown in one geom; ifgroup_sampleis"hops", thenmc_model_custom()will use animation to show each draw in one frame; ifgroup_sampleis an function, then all draws are aggregated bygroup_sample(). See examples for more details.
Examples
library(ggplot2)
library(ggdist)
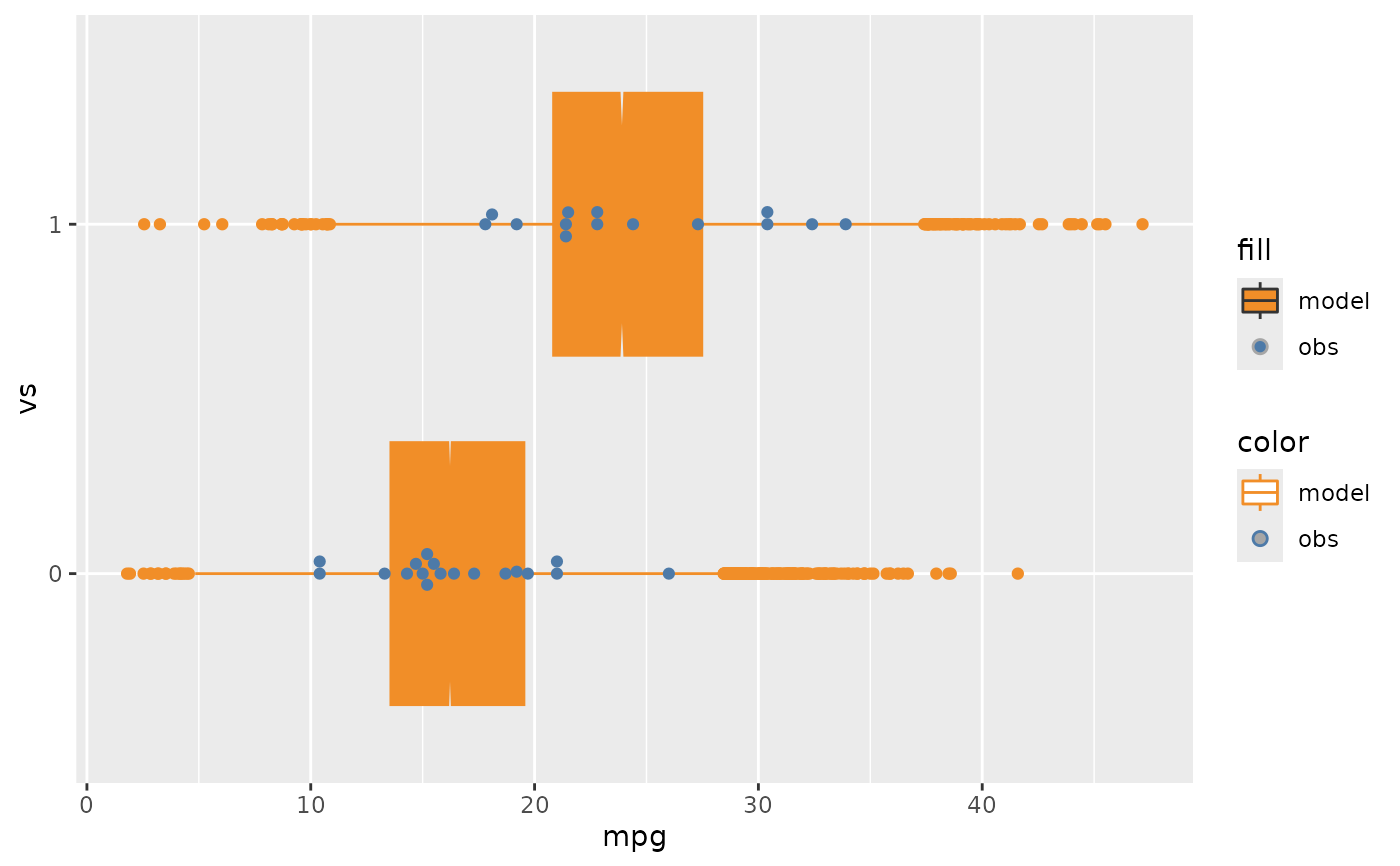
mcplot(mpg_model) +
mc_model_custom(stat_boxplot, notch = TRUE) +
mc_obs_custom(geom_swarm) +
mc_condition_on(x = vars(vs)) +
mc_gglayer(coord_flip())