Create a new mcplot
mcplot.Rdmcplot() initializes a vmc object. It follows the ggplot syntax,
which uses a plus sign (+) to define features of model check visualization.
mcplot(model, observation = NULL)Arguments
- model
The model fit object.
- observation
A data frame standing for data observations. Default to be
NULL. IfNULL,vmcwill set the observations as the data set that used to fit the model. The input data frame should include the variables in model formula.
Details
mcplot() uses a list of defaults to generate model check visualizations.
One line of mcplot(model) could generate a complete visualization for
posterior predictive checks. See vignette("vmc") for a complete
guidance.
Examples
library(ggplot2)
library(dplyr)
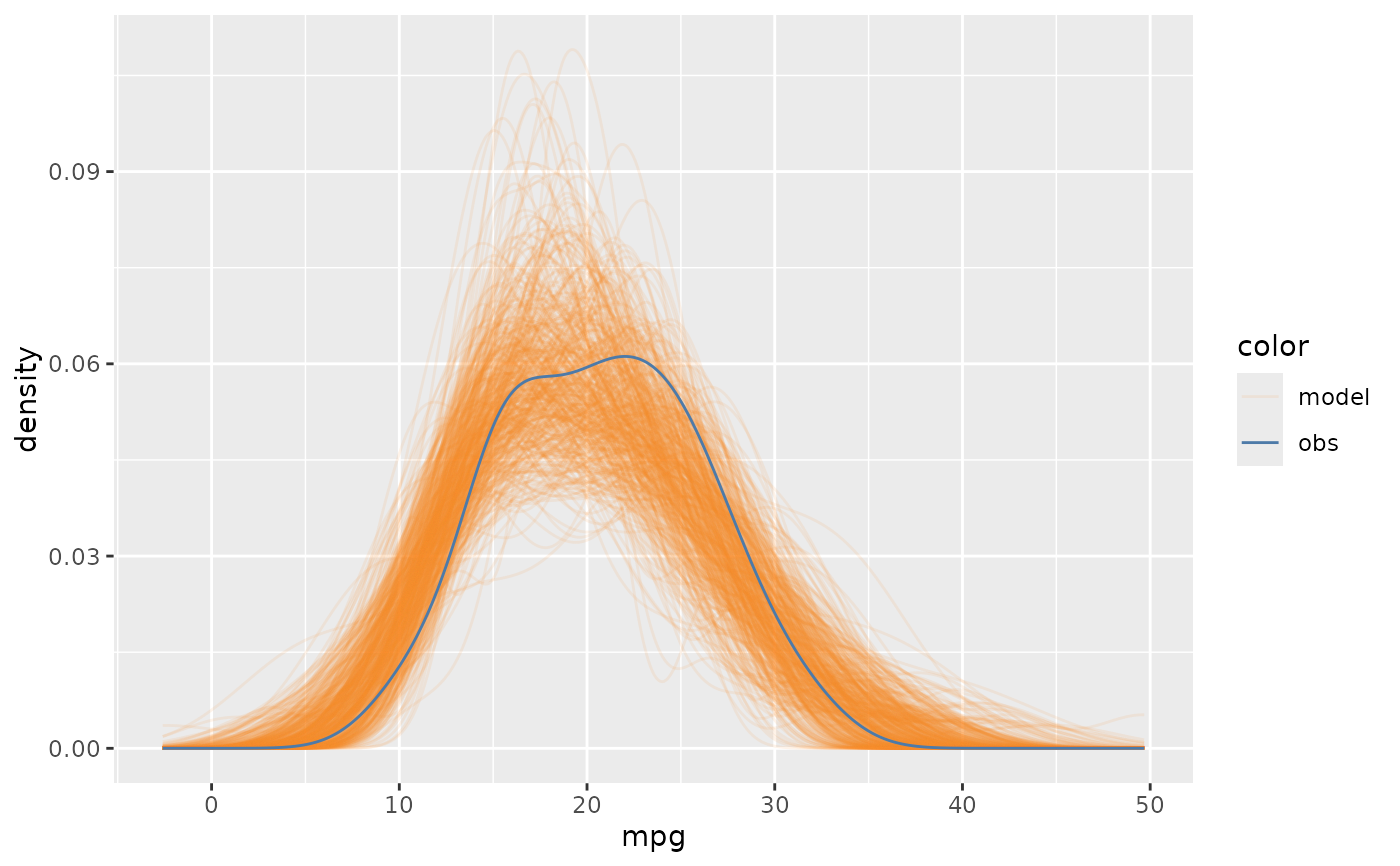
mcplot(mpg_model)
#> Warning: No shared levels found between `names(values)` of the manual scale and the
#> data's fill values.
 # note the density is on x axis and the response variable, mpg, is on y axis.
# But you can flip the coordinates by mc_gglayer()
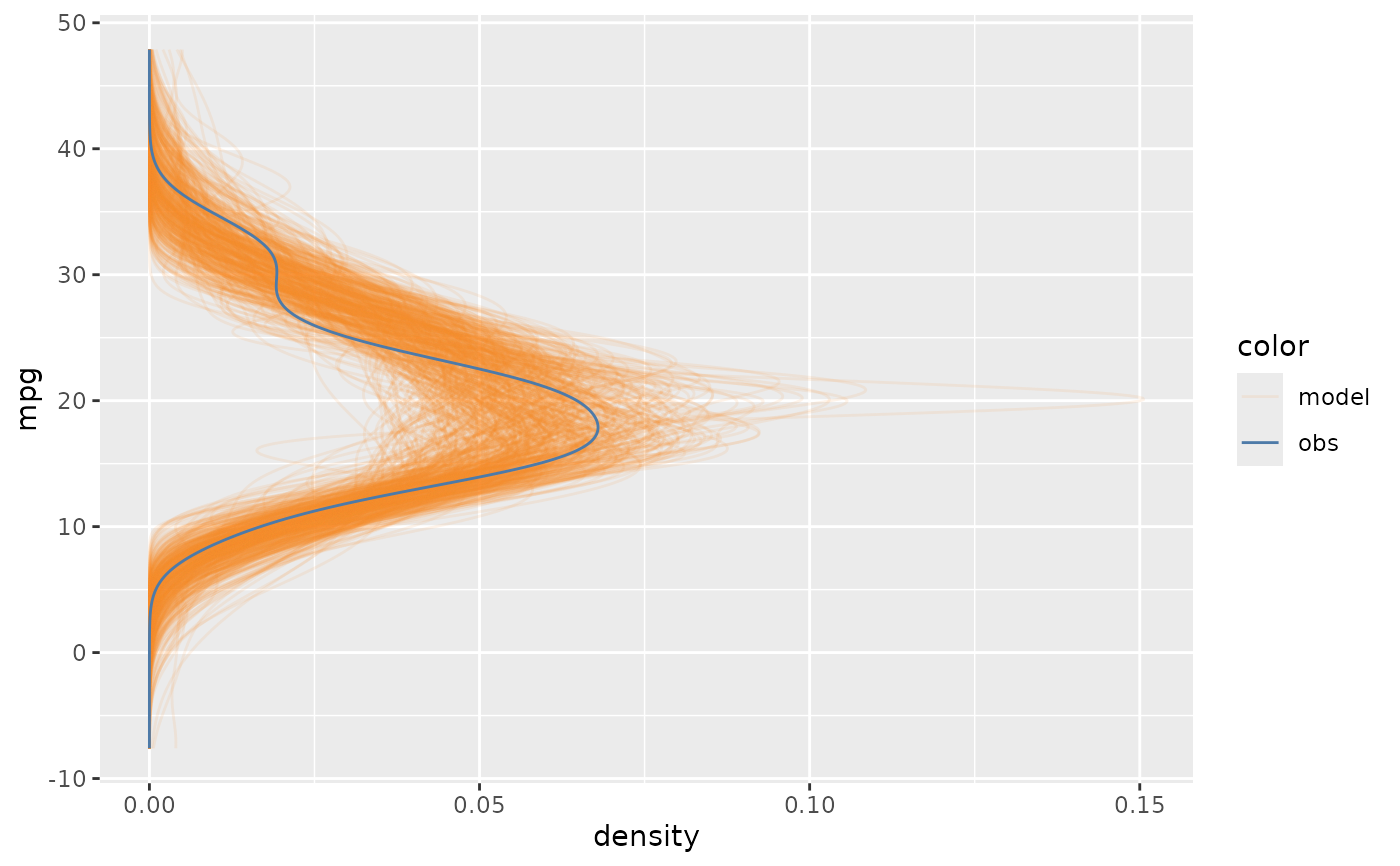
mcplot(mpg_model) +
mc_gglayer(coord_flip())
#> Warning: No shared levels found between `names(values)` of the manual scale and the
#> data's fill values.
# note the density is on x axis and the response variable, mpg, is on y axis.
# But you can flip the coordinates by mc_gglayer()
mcplot(mpg_model) +
mc_gglayer(coord_flip())
#> Warning: No shared levels found between `names(values)` of the manual scale and the
#> data's fill values.
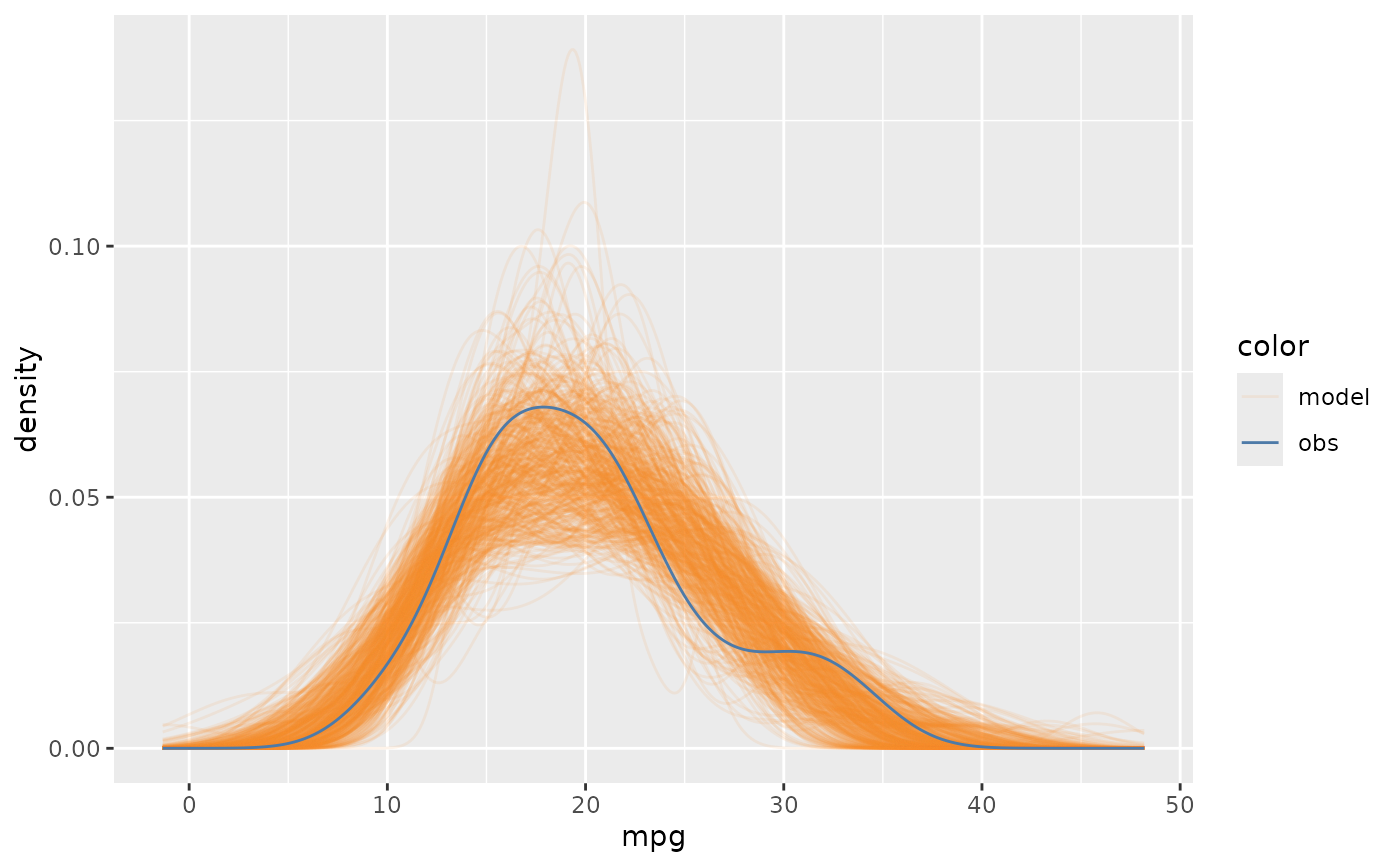 # you can also choose to use another observed data to show in model checks
new_observed_data = mtcars %>% mutate(mpg = rnorm(nrow(mtcars), 20, 5))
mcplot(mpg_model, new_observed_data) +
mc_gglayer(coord_flip())
#> Warning: No shared levels found between `names(values)` of the manual scale and the
#> data's fill values.
# you can also choose to use another observed data to show in model checks
new_observed_data = mtcars %>% mutate(mpg = rnorm(nrow(mtcars), 20, 5))
mcplot(mpg_model, new_observed_data) +
mc_gglayer(coord_flip())
#> Warning: No shared levels found between `names(values)` of the manual scale and the
#> data's fill values.