CDF bar plot for model predictions
mc_model_cdf.RdCDF bar plot for model predictions
mc_obs_cdf(...)

mc_model_cdf(..., n_sample = NA, group_sample = "collapse")
Arguments
- ...
- n_sample
The number of sample of draws to show in CDF bar plot. Default
NA. Ifn_sampleisNA, thenmc_model_cdf()will use all draws from posterior distribution.- group_sample
How to show samples? Default
"collapse". Ifgroup_sampleis"collapse", then all samples are collapsed together to show in one CDF bar plot; ifgroup_sampleis"group", then each sample is shown in an individual CDF bar plot; ifgroup_sampleis"hops", thenmc_model_cdf()will use animation to show each sample in one frame; ifgroup_sampleis an function, then all samples are aggregated bygroup_sample().
Examples
library(ggplot2)
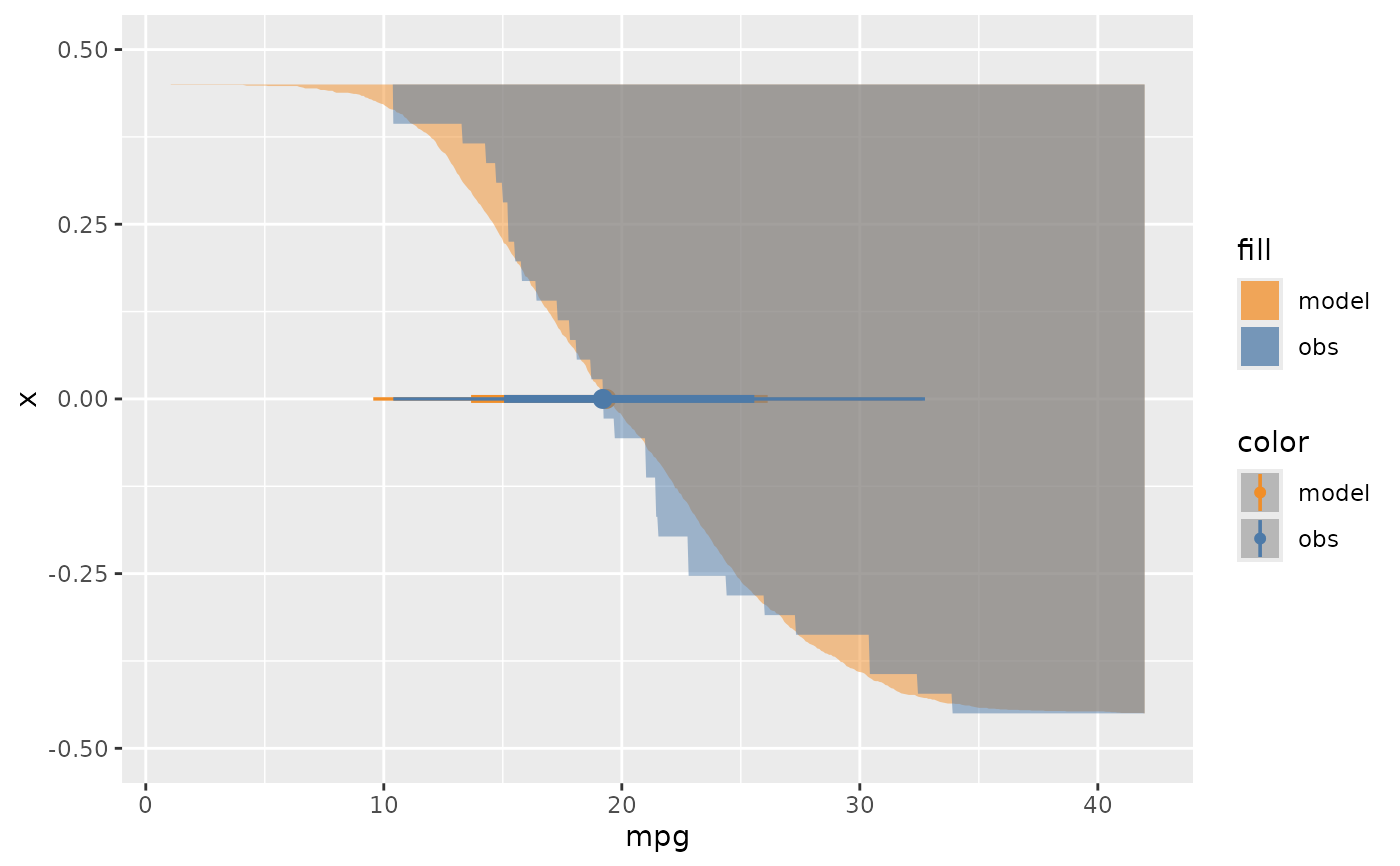
mcplot(mpg_model) +
mc_model_cdf(n_sample = 50) +
mc_obs_cdf() +
mc_gglayer(coord_flip())
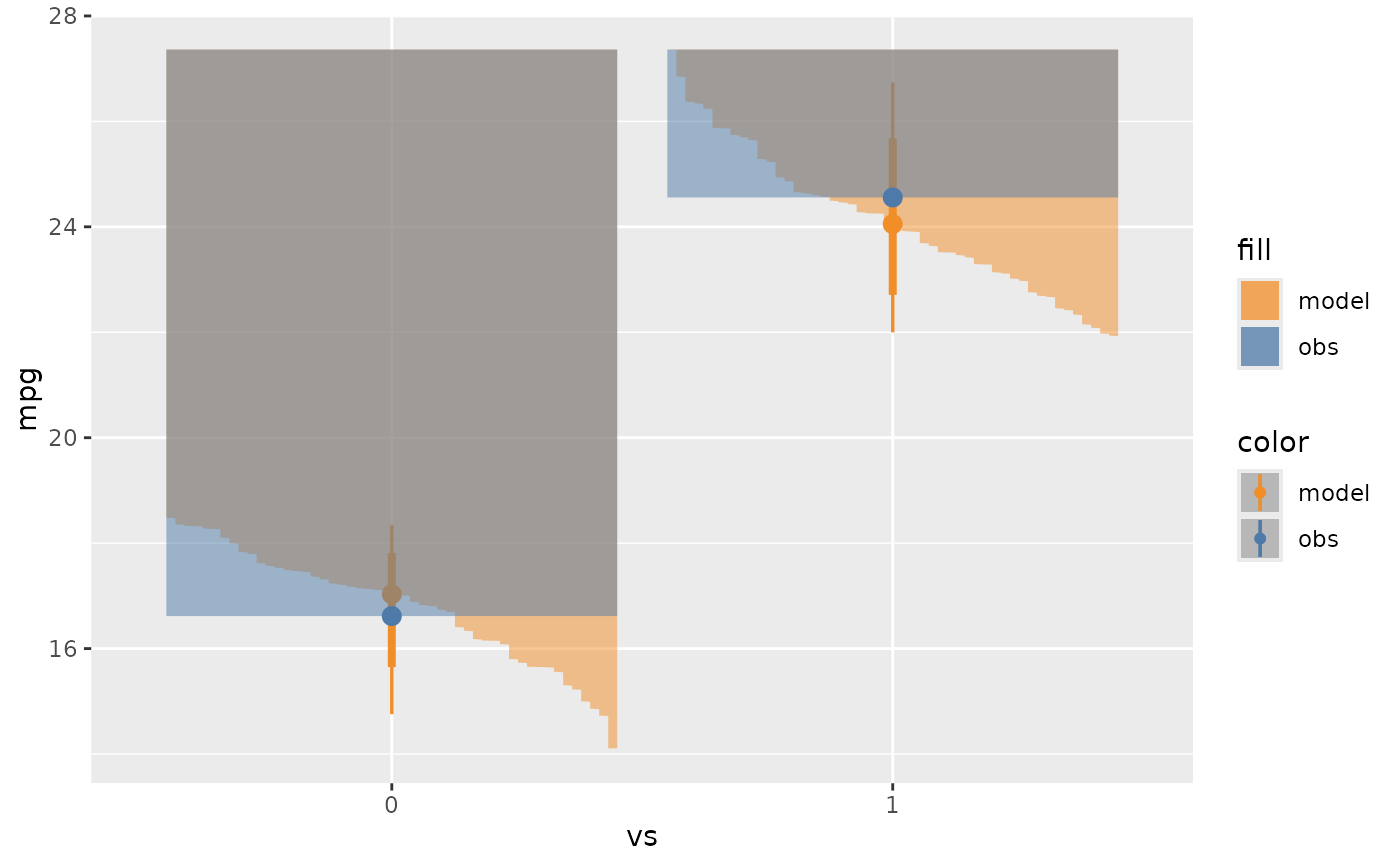
 mcplot(mpg_model) +
mc_model_cdf(n_sample = 50) +
mc_obs_cdf() +
mc_condition_on(x = vars(vs))
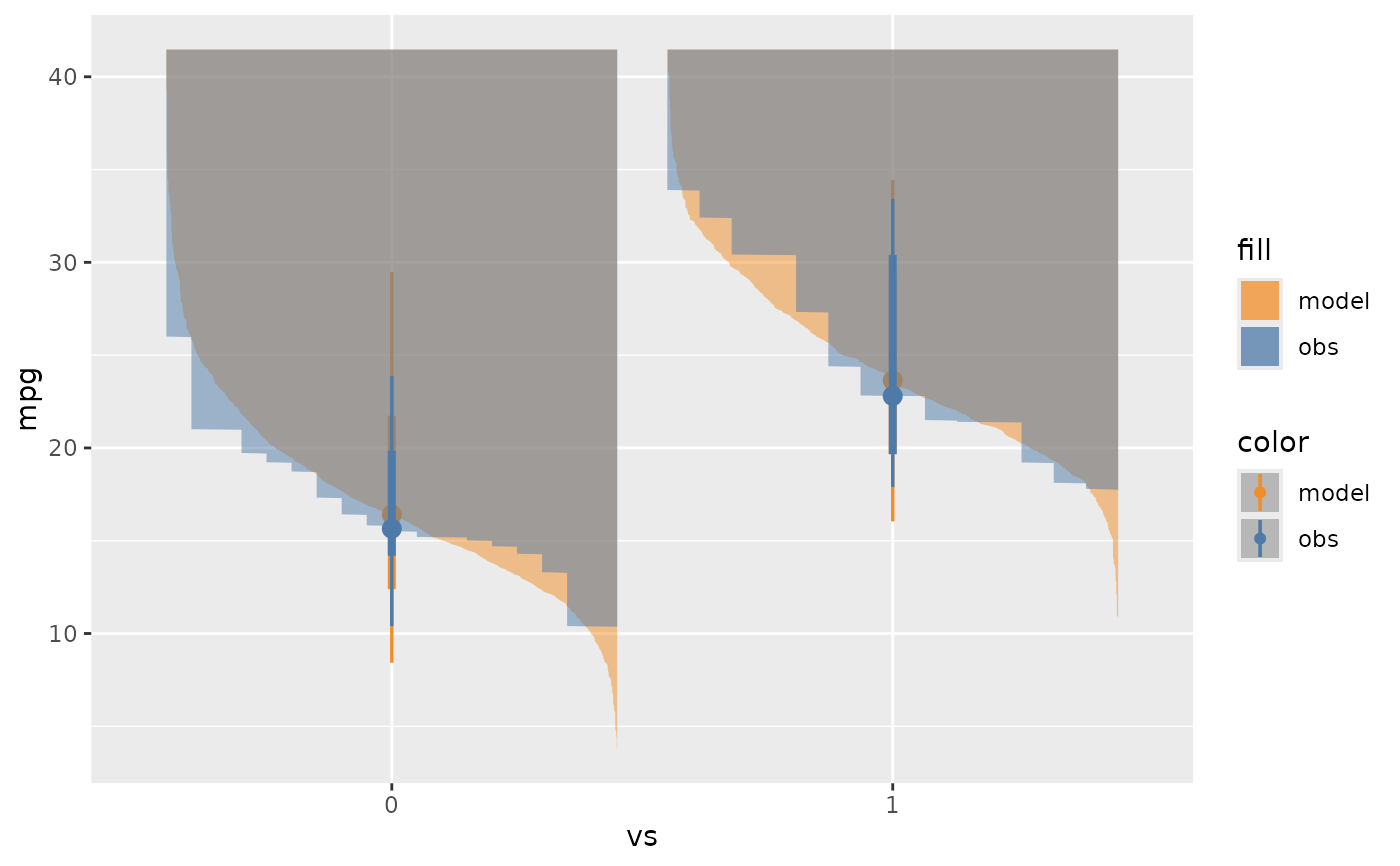
mcplot(mpg_model) +
mc_model_cdf(n_sample = 50) +
mc_obs_cdf() +
mc_condition_on(x = vars(vs))
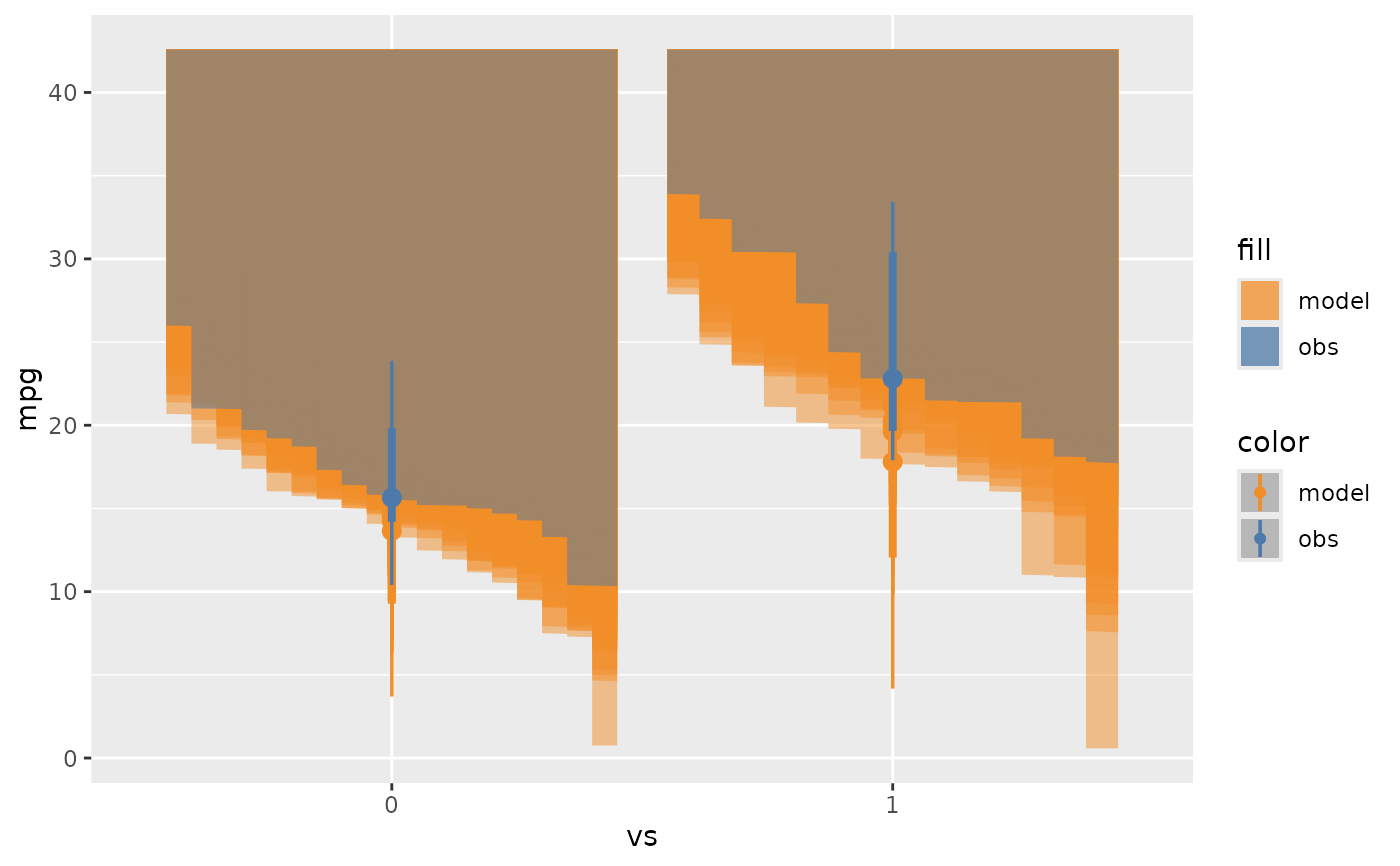
 mcplot(mpg_model) +
mc_model_cdf(n_sample = 50, group_sample = "group") +
mc_obs_cdf() +
mc_condition_on(x = vars(vs))
mcplot(mpg_model) +
mc_model_cdf(n_sample = 50, group_sample = "group") +
mc_obs_cdf() +
mc_condition_on(x = vars(vs))
 mcplot(mpg_model) +
mc_model_cdf(n_sample = 50, group_sample = mean) +
mc_observation_transformation(mean) +
mc_obs_cdf() +
mc_condition_on(x = vars(vs))
mcplot(mpg_model) +
mc_model_cdf(n_sample = 50, group_sample = mean) +
mc_observation_transformation(mean) +
mc_obs_cdf() +
mc_condition_on(x = vars(vs))