Recommend a geom
mc_model_auto.RdRecommend a geom
mc_obs_auto(...)

mc_model_auto(..., n_sample = NA, group_sample = NULL)
Arguments
- ...
Augments passed to geom functions (e.g.
ggplot2::geom_point,ggplot2::geom_line, andggplot2::geom_tile).- n_sample
The number of sample of draws to show. Default
NA. Ifn_sampleisNA, thenmc_model_auto()will use all draws from posterior distribution.- group_sample
How to show draws? Default
"collapse". Ifgroup_sampleis"collapse", then all draws are collapsed together to show in one geom; ifgroup_sampleis"group", then each draw is shown in an individual geom; ifgroup_sampleis"hops", thenmc_model_auto()will use animation to show each draw in one frame; ifgroup_sampleis an function, then all draws are aggregated bygroup_sample(). See examples for more details.
Examples
library(ggplot2)
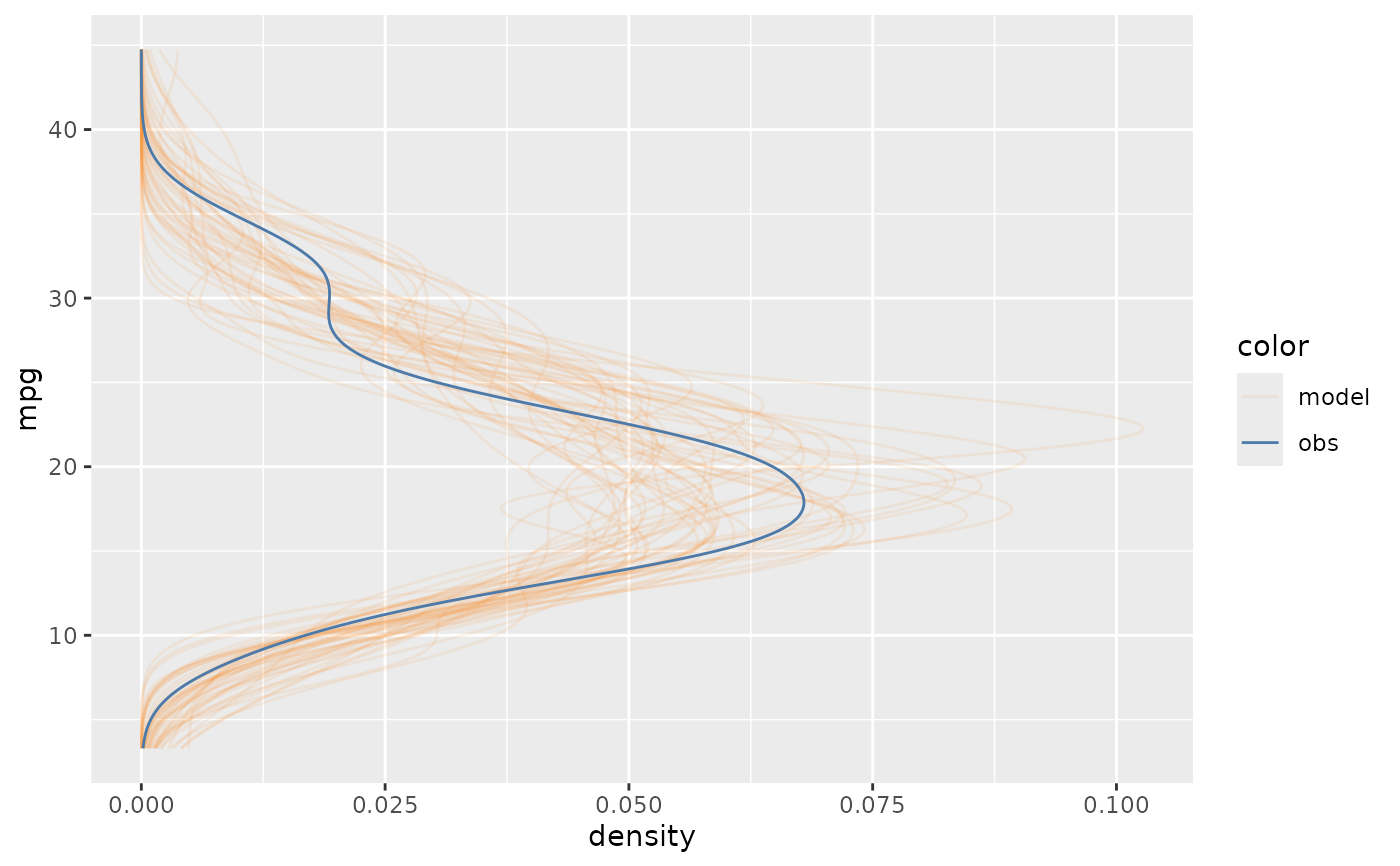
mcplot(mpg_model) +
mc_model_auto(n_sample = 50) +
mc_obs_auto()
#> Warning: No shared levels found between `names(values)` of the manual scale and the
#> data's fill values.
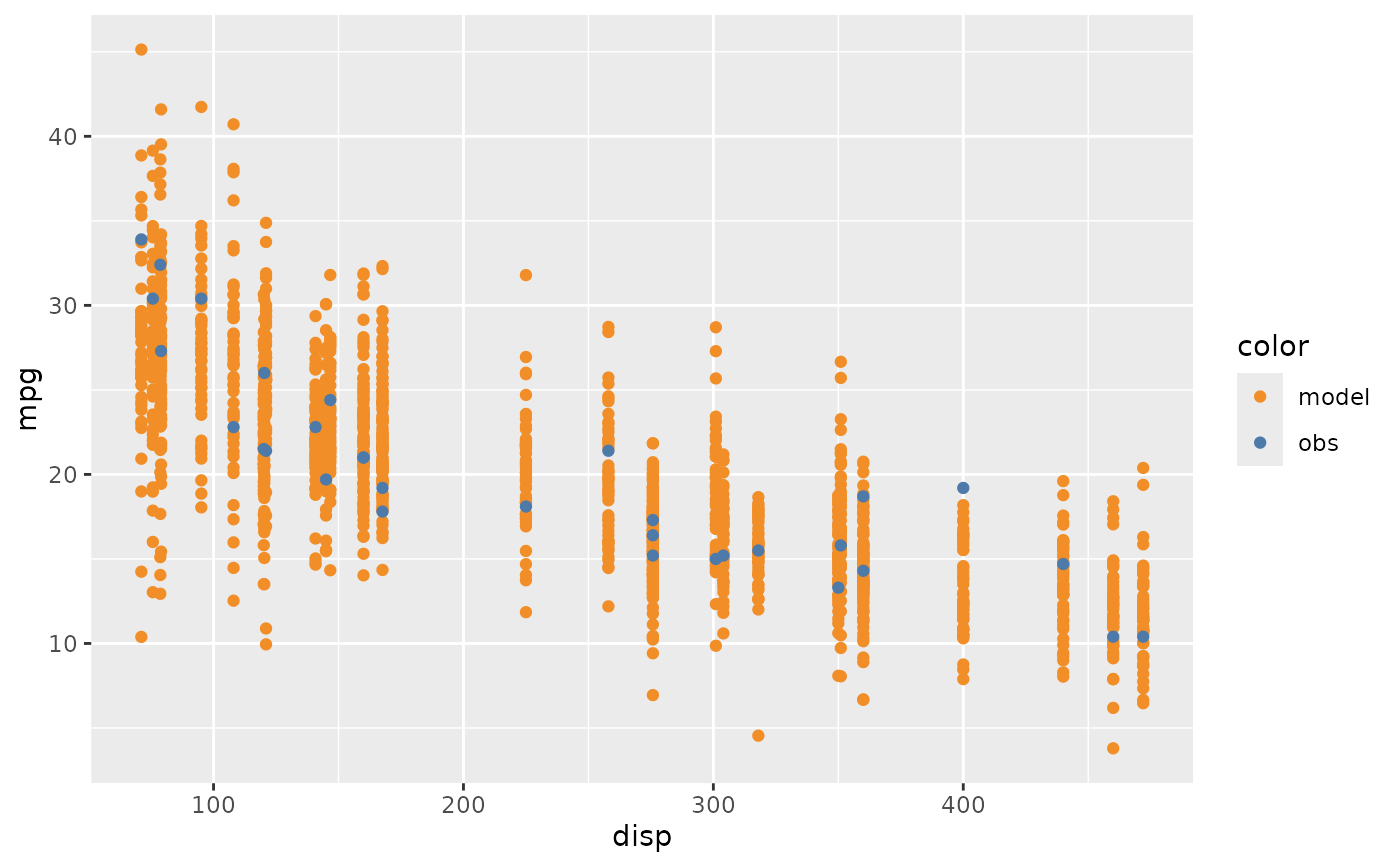
 mcplot(mpg_model) +
mc_model_auto(n_sample = 50) +
mc_obs_auto() +
mc_condition_on(x = vars(disp))
#> Warning: No shared levels found between `names(values)` of the manual scale and the
#> data's fill values.
mcplot(mpg_model) +
mc_model_auto(n_sample = 50) +
mc_obs_auto() +
mc_condition_on(x = vars(disp))
#> Warning: No shared levels found between `names(values)` of the manual scale and the
#> data's fill values.
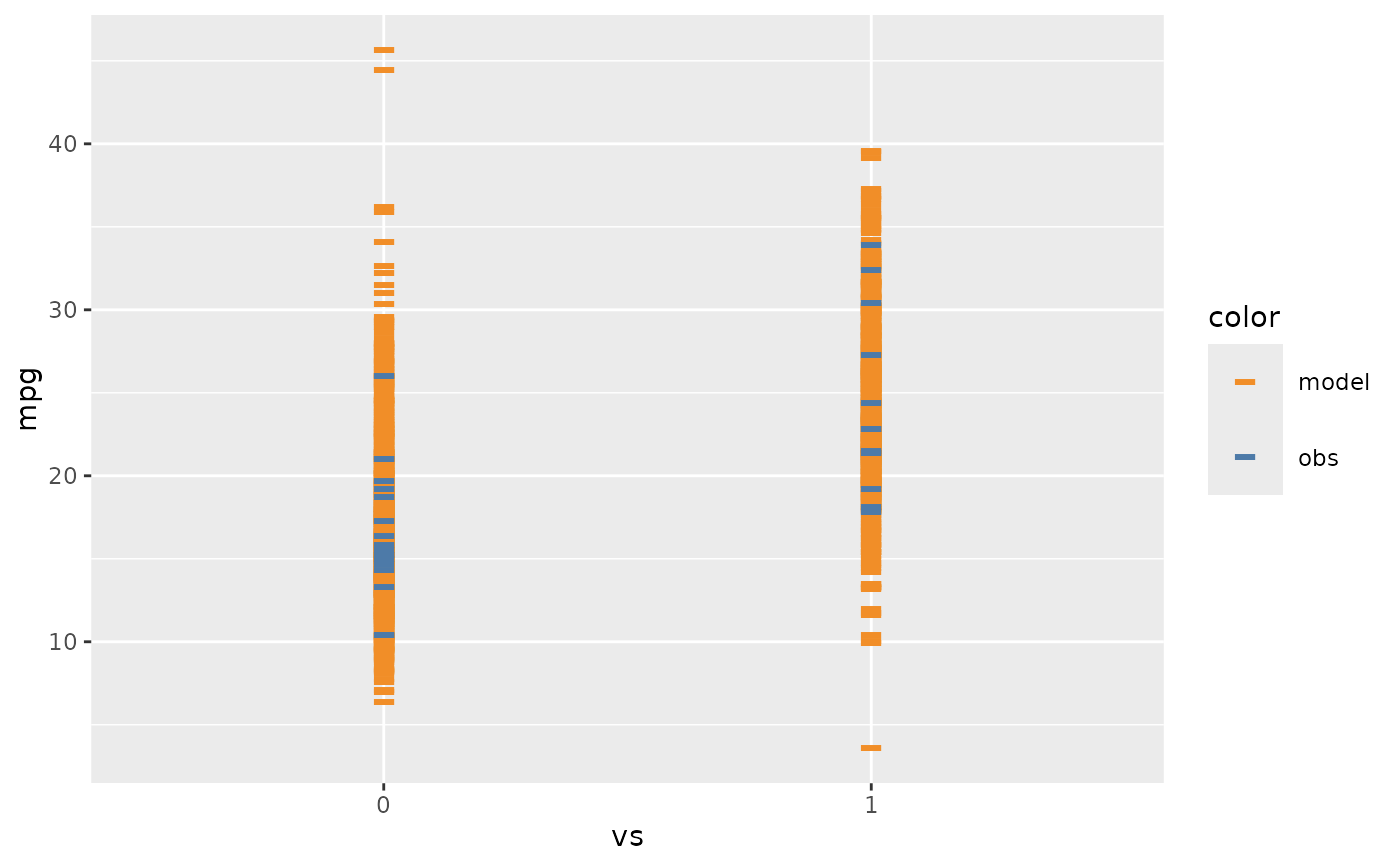
 mcplot(mpg_model) +
mc_model_auto(n_sample = 50) +
mc_obs_auto() +
mc_condition_on(x = vars(vs))
#> Warning: No shared levels found between `names(values)` of the manual scale and the
#> data's fill values.
mcplot(mpg_model) +
mc_model_auto(n_sample = 50) +
mc_obs_auto() +
mc_condition_on(x = vars(vs))
#> Warning: No shared levels found between `names(values)` of the manual scale and the
#> data's fill values.