Visualization Equilibrium
IEEE Trans. Visualization & Comp. Graphics (Proc. INFOVIS) 2021Abstract
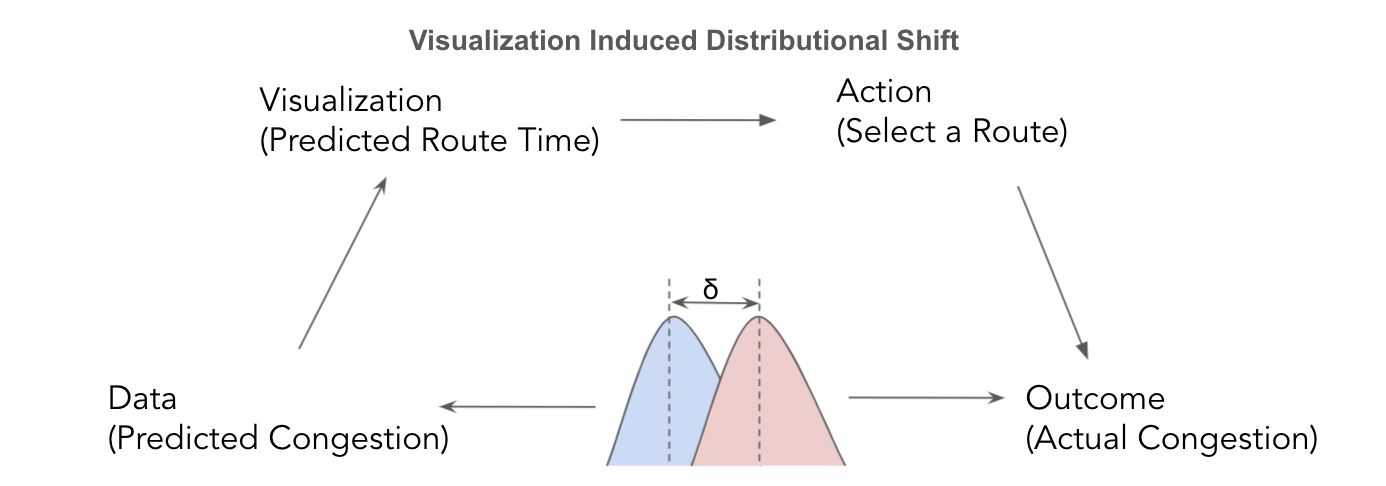
In many real-world strategic settings, people use information displays to make decisions. In these settings, an information provider chooses which information to provide to strategic agents and how to present it, and agents formulate a best response based on the information and their anticipation of how others will behave. We contribute the results of a controlled online experiment to examine how the provision and presentation of information impacts people’s decisions in a congestion game. Our experiment compares how different visualization approaches for displaying this information, including bar charts and hypothetical outcome plots, and different information conditions, including where the visualized information is private versus public (i.e., available to all agents), affect decision making and welfare. We characterize the effects of visualization anticipation, referring to changes to behavior when an agent goes from alone having access to a visualization to knowing that others also have access to the visualization to guide their decisions. We also empirically identify the visualization equilibrium, i.e., the visualization for which the visualized outcome of agents’ decisions matches the realized decisions of the agents who view it. We reflect on the implications of visualization equilibria and visualization anticipation for designing information displays for real-world strategic settings.
Citation
BibTeX
@article{vis-equilibrium-2021,
	title        = {Visualization Equilibrium},
	author       = {Kayongo, Paula and Sun, Glenn and Hartline, Jason and Hullman, Jessica},
	year         = 2022,
	journal      = {IEEE Transactions on Visualization and Computer Graphics},
	volume       = 28,
	number       = 1,
	pages        = {465--474},
	doi          = {10.1109/TVCG.2021.3114842}
}

