Imagining Replications: Graphical Prediction & Discrete Visualizations Improve Recall & Estimation of Effect Uncertainty
IEEE Trans. Visualization & Comp. Graphics (Proc. INFOVIS) 2017Abstract
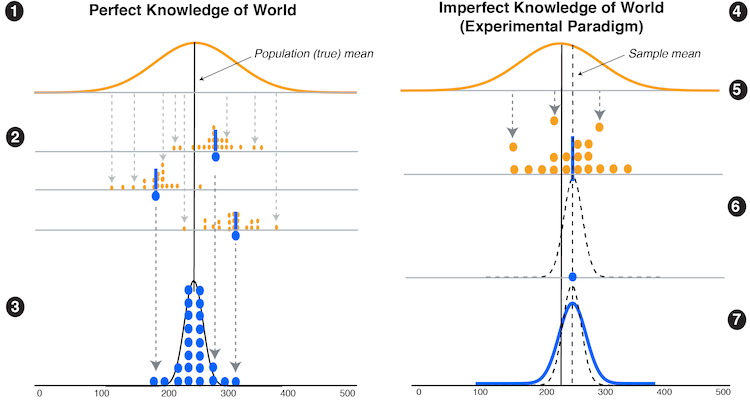
People often have erroneous intuitions about the results of uncertain processes, such as scientific experiments. Many uncertainty visualizations assume considerable statistical knowledge, but have been shown to prompt erroneous conclusions even when users possess this knowledge. Active learning approaches have been shown to improve statistical reasoning, but are rarely applied in visualizing uncertainty in scientific reports. We present a controlled study to evaluate the impact of an interactive, graphical uncertainty prediction technique for communicating uncertainty in experiment results. Using our technique, users sketch their prediction of the uncertainty in experimental effects prior to viewing the true sampling distribution from an experiment. We find that having a user graphically predict the possible effects from experiment replications is an effective way to improve one’s ability to make predictions about replications of new experiments. Additionally, visualizing uncertainty as a set of discrete outcomes, as opposed to a continuous probability distribution, can improve recall of a sampling distribution from a single experiment. Our work has implications for various applications where it is important to elicit peoples’ estimates of probability distributions and to communicate uncertainty effectively.
Citation
BibTeX
@article{imagining-replications-2017,
	title        = {Imagining Replications: Graphical Prediction & Discrete Visualizations Improve Recall & Estimation of Effect Uncertainty},
	author       = {Hullman, Jessica and Kay, Matthew and Kim, Yea-Seul and Shrestha, Samana},
	year         = 2018,
	journal      = {IEEE Transactions on Visualization and Computer Graphics},
	volume       = 24,
	number       = 1,
	pages        = {446--456},
	doi          = {10.1109/TVCG.2017.2743898}
}

